

Forex Chart Types are essential tools that traders use to analyze currency price movements and make informed decisions in the foreign exchange market. These charts, such as line charts, bar charts, and candlestick charts, each provide unique insights into market trends and price behavior. Visit tipstrade.org and check out the article below for further information
What Are Forex Chart Types?
A forex chart is a graphical representation of the price movement of a currency pair — such as EUR/USD or GBP/JPY — over a specific time frame. Whether a trader is scalping 1-minute charts or analysing weekly trends, charts help answer key questions:
- Is the market trending or ranging?
- Are buyers (bulls) or sellers (bears) in control?
- Where did price recently react — support or resistance?
- Is volatility increasing or decreasing?
There are three core price components most charts display:
| Price Metric | Meaning |
| Open | Price at the start of a chosen time period |
| Close | Price at the end of a chosen time period |
| High | The highest price reached |
| Low | The lowest price reached |
Not every chart shows all four metrics, which is why different chart types suit different trading styles.
>>See more:
- What is Industry Comparison and How to do it?
- What are Profitability Ratios? Types & Its Significance
- Key Stock Valuation Ratios and When to Use Which One
- How to Read Financial Statements Like a Pro in Stock Investment
Main Forex Chart Types Explained
Below are the most widely-used forex chart types beginners should know:
-
- Line Chart
- Bar Chart
- Candlestick Chart
- Heiken Ashi
- Renko Chart
- Tick, Range, and other advanced charts (brief overview)
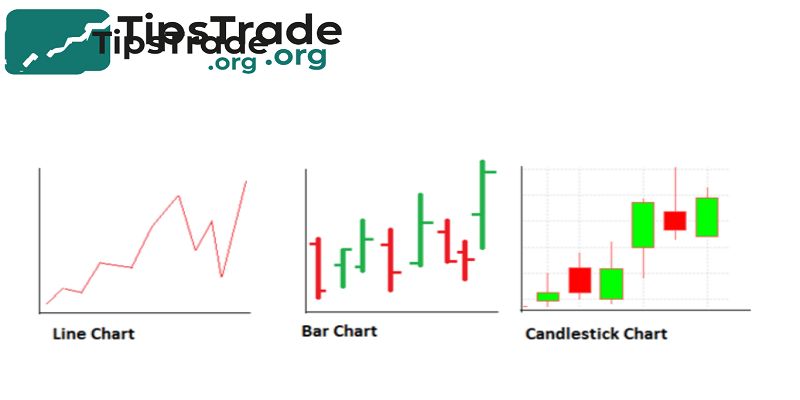
Line Chart (The simplest chart type)
A line chart connects the closing price of each period with a continuous line. It is minimal, clean, and easy to read — often the first chart beginners understand.
Why traders use line charts:
- Shows overall direction of price clearly
- Removes noise and distractions
- Perfect for identifying long-term trends
Example:
If EUR/USD closes at 1.0800 → 1.0850 → 1.0900 → 1.0880,
a line chart will simply draw points and connect them.
Many long-term analysts, hedge funds, and macro economists use line charts when studying monthly and weekly trends.
Advantages
- Very simple and beginner-friendly
- Helps visualise long-term direction
- Reduces price noise
Limitations
- Does not show highs, lows, or volatility
- Not ideal for scalping or intraday entries
Best for:
→ New traders, long-term investors, high-level trend analysis.
Bar Chart (Open-High-Low-Close, also called OHLC)
Bar charts add more detail. Instead of just the closing price, each bar shows open, high, low, and close.
A single bar looks like this:
- Vertical line = full price range (high → low)
- Small left tick = open price
- Small right tick = close price
Example:
If GBP/USD opens at 1.2200, falls to 1.2180, rises to 1.2240, and closes at 1.2215 — one bar will show all 4 points.
Advantages
- More detail than line charts
- Traders can see volatility and market sentiment
- Useful for breakout and support/resistance levels
Limitations
- Harder to read for beginners
- No visual “candle body” like candlesticks
- Best for:
→ Swing traders, day traders, technical analysts.
Candlestick Chart (Most popular chart type worldwide)
Candlestick charts are the standard in Forex and are used by professional traders globally. Each candle shows:
- Open price
- Close price
- High & Low
- Colour shows direction (Bullish or Bearish)
A bullish candle usually appears white or green. A bearish candle appears black or red.
Why traders love candlestick charts:
- Easy to read visually
- Shows market psychology
- Works with price action and pattern strategies
- Compatible with indicators (MA, RSI, MACD)
Common Candlestick Patterns Beginners Learn First
| Pattern | Meaning |
| Doji | indecision — possible trend reversal |
| Hammer | bullish reversal at support |
| Engulfing | strong change in direction |
| Shooting Star | bearish reversal at resistance |
Example:
If USD/JPY forms a bullish engulfing candlestick at a major support zone, many traders see that as buying pressure returning.
Advantages
- Most widely used and well-researched
- Easy to spot patterns and emotions
- Ideal for price action strategies
Limitations
- Can appear noisy on small time frames
- New traders may over-interpret patterns
Best for:
Day traders, price action traders, swing traders, prop firm traders.
Heikin Ashi (Smoothed trend-filtering chart)
Heikin Ashi modifies candle calculations to smooth out price swings. Instead of showing exact open and close, it shows an average of price — creating cleaner trends.
With Heikin Ashi:
- Green candles often stay green longer
- Red candles often stay red longer
- Wicks shorten during strong trends
Example:
When EUR/JPY is trending strongly, normal candlesticks may show many small pullbacks. Heikin Ashi makes the trend look smoother and easier to follow.
Advantages
- Filters noise
- Clearer trend direction
- Good for trend-following beginners
Limitations
- Not precise price data
- Not suitable for exact entries/exits
Best for:
→ Swing traders who follow the overall trend.
Renko Chart (Movement-based, not time-based)
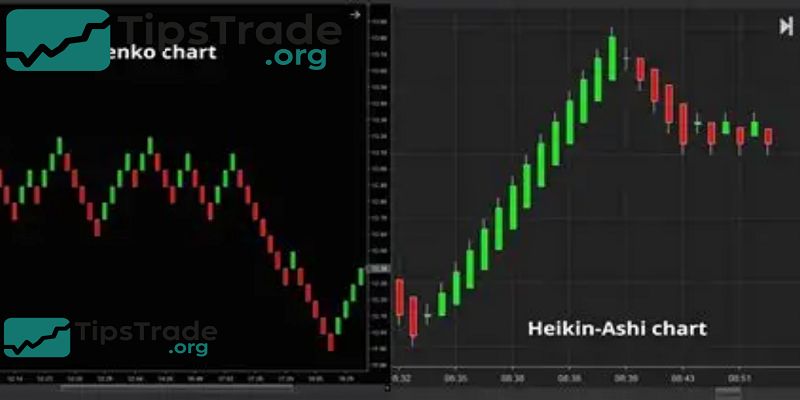
Renko charts ONLY draw bricks when price moves a certain amount — for example, 10 pips. This removes market noise and focuses on pure movement.
If EUR/USD moves up 20 pips, two bricks form.
No time element — price must move, or the chart stays still.
Advantages
- Extremely clean
- Perfect for trend followers and scalpers
- Helps identify key support/resistance
Limitations
- No time data included
- Not every broker supports Renko
Best for:
→ Traders who hate noise and want simple trend structure.
Which Forex Chart Type Is Best for Beginners?
| Trader Style | Recommended Chart Type |
| Complete beginner | Line Chart → Candlestick Chart |
| Price action student | Candlestick |
| Trend follower | Heikin Ashi / Renko |
| Scalper | Renko / Candlestick (1m–5m) |
| Swing trader | Candlestick / Bar Chart |
| Long-term investor | Line Chart (Daily/Weekly) |
Most traders eventually choose candlestick charts because they offer the best balance of detail and speed.
Conclusion
Forex Chart Types play a crucial role in helping traders identify patterns and predict future price action. In conclusion, understanding these chart types is fundamental for successful forex trading and improving overall market analysis skills. Through this article, tipstrade.org wish you luck and success on your trading journey. Hopefully, the in-depth analysis of Stock Market Trends will help you make smart and profitable investment decisions.
See more:
- Impact of Macroeconomic Factors on Stocks
- What is bid ask spread? Factors that influence bid ask spread
- Fundamental Analysis Stocks: Everything Investors Need to Know
- Technical Analysis for Stocks: The Complete Guide for Modern Investors