
Technical indicators are indispensable tools that help technical analysts identify the appropriate times to buy and sell goods, and make informed trading decisions. Here are the technical indicators commonly used by investors in technical trading analysis.
What are technical indicators?
Technical indicators are tools used in technical analysis to predict the price trends of an asset based on historical price and trading volume data. These indicators are represented as graphs or symbols, making it easy for investors to visualize and analyze the data.
>>See more:
- Mastering candlestick patterns for effective trading
- Best Popular Types of Reversal Patterns In Trading
- All useful chart patterns in technical analysis you should know
- Top 5 Most Common Continuation Patterns to Capture Market Trends
Uses of technical indicators
Technical Indicators are basically used:
- Trend prediction: The indicator helps identify the current trend (up, down, or sideways) and predicts the likelihood of that trend continuing or changing, helping investors know the best time to enter or exit orders.
- Support quick decisions: Through signals from indicators such as moving averages, RSI, MACD,… investors can easily make decisions without having to analyze too much data.
- Eliminate emotions in trading: Technical indicators are based on objective data, helping investors avoid decisions influenced by emotions, thereby improving their risk management ability.
- Optimize trading strategy: By combining multiple indicators at the same time, investors will build a more flexible and well-founded trading strategy, increasing the likelihood of success in both short-term and long-term transactions.
Types of technical indicators
Currently, there are several hundred indicators, and they can be classified in many ways. Each indicator has a different calculation formula, ranging from basic to complex. Additionally, each indicator is used for different purposes. So, investors need to do their research before choosing indicators. It can be divided into 4 main types as follows:
Trend following indicators
This is a technical indicator used to determine the direction of price fluctuations in financial markets. Based on these indicators, investors will be able to identify trends, average price levels, and measure price volatility. Some examples of this technical indicator are Moving Average, Parabolic SAR, Ichimoku, etc.
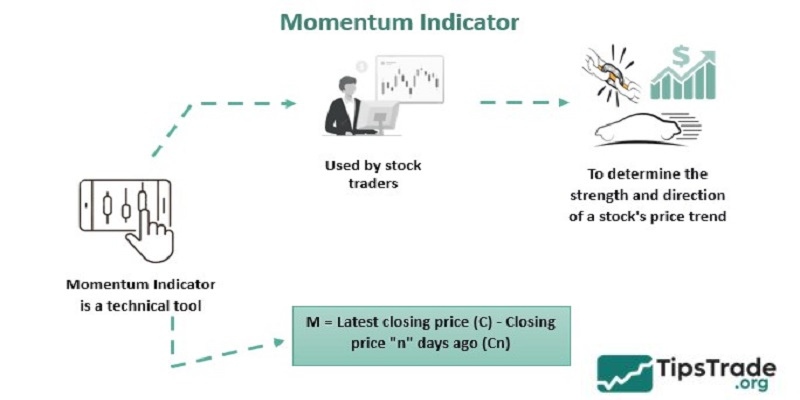
Momentum indicators
Momentum measures motion. Momentum indicators are technical analysis tools used to determine the strength or weakness of an asset’s price. Although their main use is to indicate the strength of a trend, momentum indicators also indicate when a trend has slowed and possibly ready for a change. Some of the momentum indicators are Stochastic, RSI, ROC, William % R, CCI etc.
Volatility indicators
These are technical analysis tools used to observe the movement of market prices over a certain period of time. The faster the price changes, the higher the volatility. Conversely, the slower the price changes, the lower the volatility. Some popular volatility indicators include Average True Range (ATR), Bollinger Bands, etc.
Volume indicators
Volume indicators measure the total amount of financial assets traded at a given time. This is a very powerful tool to assess the strength of the bulls and bears in popular financial markets such as stocks, forex or crypto. Accordingly, high trading volume indicates strong buying pressure, causing the indicator to rise, and vice versa. Some popular volatility indicators include Chaikin oscillator, OBV, etc.
Best technical indicators you should be aware of
Here are some popular and effective technical indicators that you can’t miss:
Moving average (MA)
Moving averages help investors track commodity price trends over time by using historical price data to smooth out short-term fluctuations.
Popular types of moving averages:
- Simple moving average (SMA): SMA is calculated by averaging the price of a commodity over a number of trading sessions. SMA provides a comprehensive view of long-term trends, however it can be slow to react to short-term market changes.
- Exponential moving average (EMA): Unlike SMA, EMA gives more weight to recent trading sessions, thus reacting more quickly to recent price changes. This makes EMA more suitable for short-term trading strategies.
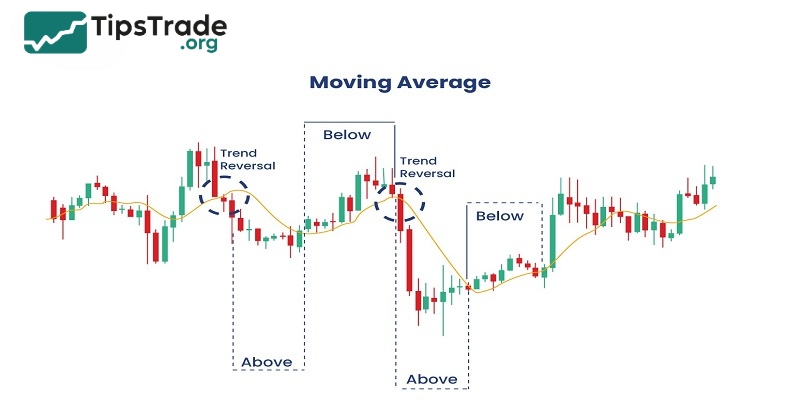
Note: Moving average (MA) does not accurately predict future trends but reflects past price movements, helping investors identify general market trends and adjust trading strategies appropriately.
Moving average convergence divergence (MACD)
MACD (Moving Average Convergence Divergence) is a technical indicator that helps identify price trends and momentum of commodities.
MACD is calculated by taking the difference between two moving averages (EMAs), usually a 12-period EMA and a 26-period EMA. A 9-period EMA is then used as a signal, helping to determine buy or sell points.
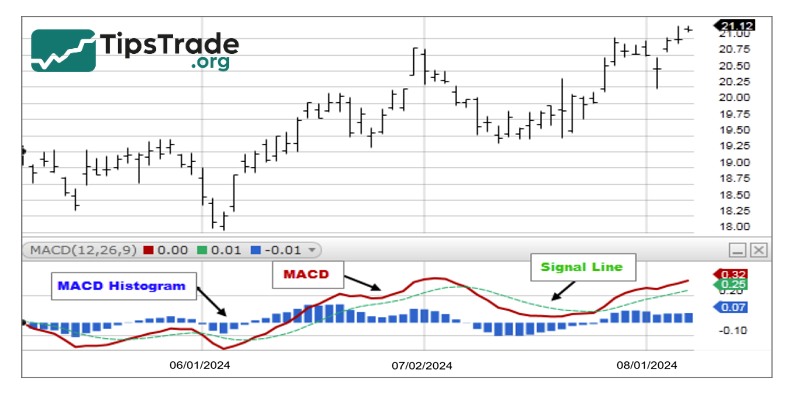
How to use MACD:
- Buy signal: When the MACD line crosses above the signal line, it is a sign of an uptrend. This is usually a time to buy.
- Sell signal: Conversely, when the MACD line crosses below the signal line, this signals a downtrend and could be a time to sell.
- Divergence and convergence: MACD also provides information about a possible reversal when the price and the MACD indicator diverge (price increases but MACD decreases) or converge (price decreases but MACD increases), helping to identify a possible change in trend.
Relative strength index (RSI)
RSI (Relative Strength Index) is a technical indicator used to measure the price momentum of a commodity on a scale of 0 to 100.
The RSI indicator helps investors identify overbought or oversold conditions of commodities, thereby predicting the possibility of price reversal.
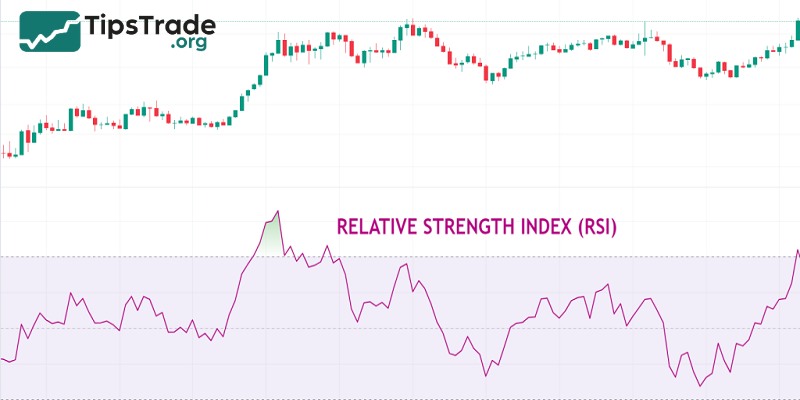
How to use RSI:
- Overbought zone (RSI > 70): When the RSI crosses 70, the commodity may be overbought, leading to a possible price correction. This is a signal for investors to sell.
- Oversold zone (RSI < 30): When the RSI is below 30, the commodity may be oversold, with a potential price recovery. This is a potential buy signal.
Bollinger bands
Bollinger Bands is a technical indicator developed by John Bollinger in the 1980s, consisting of three bands: an upper band, a middle band (a simple moving average SMA), and a lower band.
These bands help measure price volatility and identify overbought or oversold areas in the market.
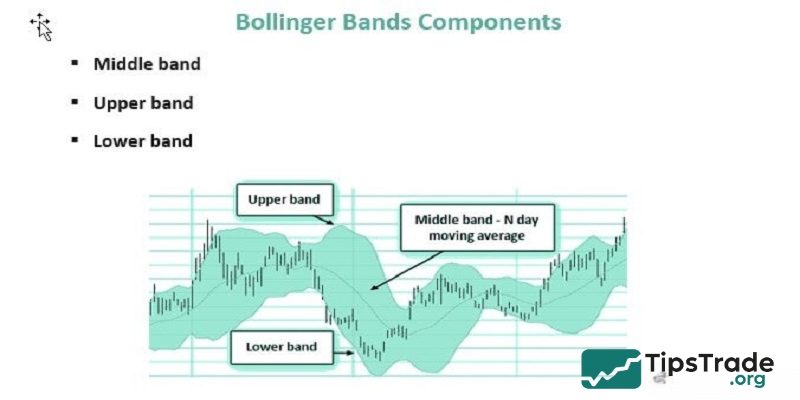
How to use Bollinger Bands:
- Overbought and oversold: When the price touches the upper band, the market may be overbought, which could be a signal to sell. Conversely, when the price touches the lower band, the market may be oversold, which could be a signal to buy.
- Bollinger Bands Squeeze Strategy: When the bands narrow (squeeze), it is a sign that the market is about to make a big move. If the price breaks the upper band, it is a buy signal; if the price breaks the lower band, it is a sell signal.
- Breakout trading: When the price breaks out of either band (upper or lower), a breakout may occur. This signals that the price is likely to move more volatile in the future.
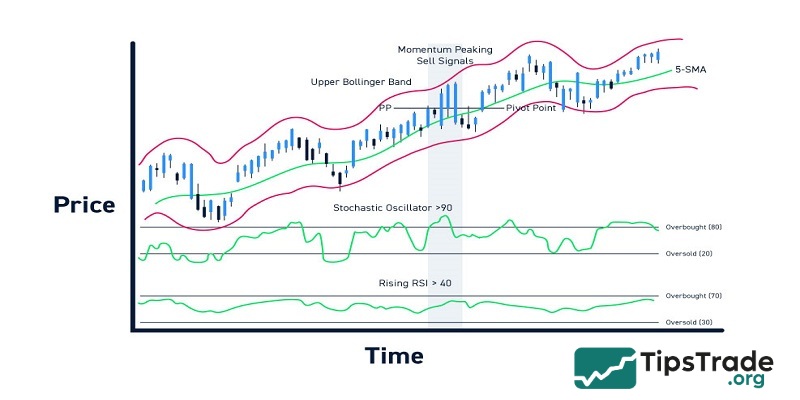
Stochastic oscillator
The Stochastic Oscillator measures the current position of the price relative to the high-low range over a given period of time, ranging from 0 to 100. The indicator consists of two lines:
- %K Line: This is the main line, which represents the raw Stochastic value. It measures the position of the current closing price relative to the highest and lowest price range over the specified time period.
- %D Line: This is a 3-period simple moving average of the %K Line. This line acts as a signal line to generate trading signals based on intersections with the %K Line.
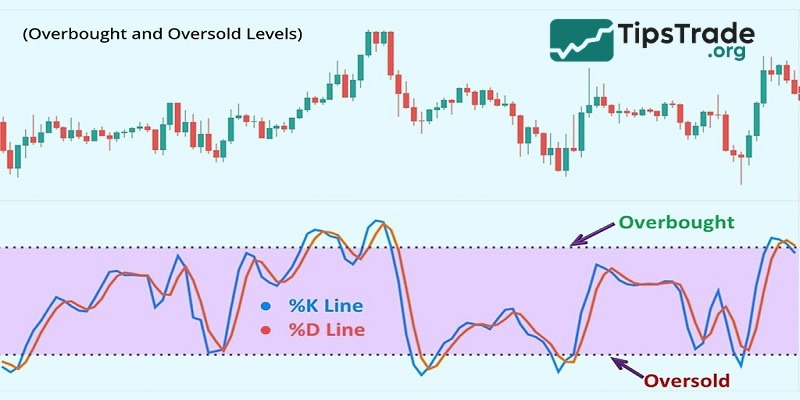
How to identify the main signal:
- When Stochastic crosses 80: The market is overbought, a bearish reversal is likely.
- When Stochastic is below 20: The market is oversold, with potential for a bullish reversal.
The 80 and 20 levels act as warning levels, helping traders time their entry and exit based on price momentum.
Tips for using technical indicators
Technical indicators will help investors increase the probability of success when placing orders. But this tool is not a “holy grail”. Below are some notes when using technical indicators to make trading more effective.
- When using any tool, the most important thing is to determine the trend. If the trader cannot determine the trend and only relies on Buy/Sell signals from indicators, the risk of loss is very high.
- There are hundreds of technical indicators in the arsenal. Traders need to understand the nature of each indicator before choosing to use it. To understand the nature of each indicator, traders need to look closely at the formula that makes up the technical indicator.
- Signal conflicts between technical indicators are also an issue that traders need to understand clearly. Each technical indicator is made up of different formulas. Therefore, depending on the time frame and trading method, traders can choose a suitable group of indicators.
Conclusion
These are the common technical indicators that most investors are using in technical analysis. Each of the indicators above has its own advantages and disadvantages, so you should choose the indicators that are suitable for your trading strategy.