
Candlestick patterns can be said to be a useful technical analysis tool used by traders to track price trends in the market, thereby determining the appropriate times to buy and sell financial assets. Let’s explore candlestick patterns with Tipstrade.org in the following article!
What are candlestick patterns?
A candlestick pattern is a type of price chart that shows price fluctuations over a certain time frame (1 second, 1 minute, 15 minutes, 1 hour, 4 hours, 1 day, 1 week etc.). Each candle provides 4 main pieces of information:
- Opening price: Price at the start of the trading session.
- Closing price: Price at the end of the trading session.
- Highest price: The highest price reached during the session.
- Lowest price: Lowest price of the session.
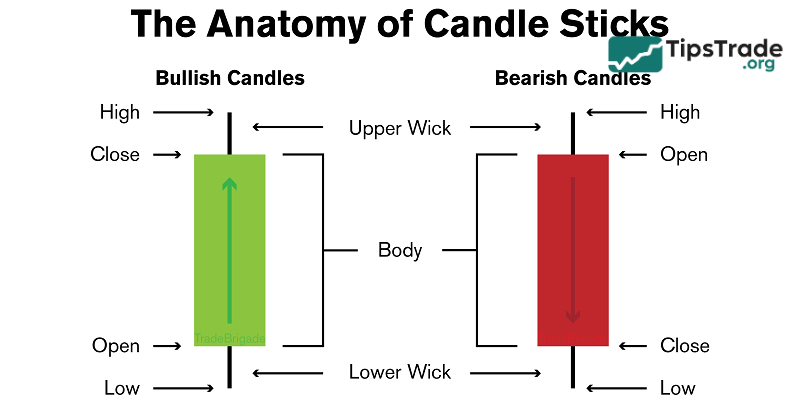
Anatomy of a candlestick pattern
Each candlestick pattern consists of:
- Body: The range between the opening and closing prices.
- Wicks/Shadows: Lines extending from the body, showing the high and low of the period.
- Color: Typically, a bullish candle is green or white (close > open), while a bearish candle is red or black (open > close).
Why candlestick patterns are important in technical analysis
Candlestick pattern are not just figures; they also tell the story of market behavior. A long bullish candle indicates buyers are in control, a long bearish candle signals sellers are in charge, and a long candle wick shows a tug-of-war between the two sides.
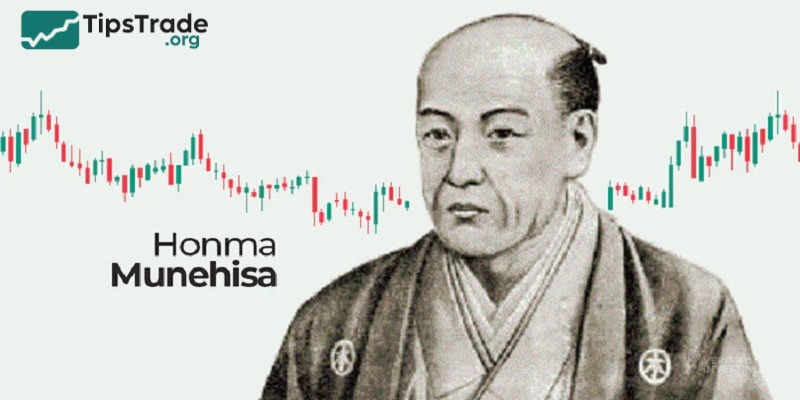
History of candlestick patterns
Candlestick patterns, also known as Japanese candlestick patterns, were invented by Munehisa Homma, a Japanese rice trader in the 18th century at the Dojima market (Osaka, Japan). Homma realized that the price of rice not only depends on supply and demand but is also affected by the psychology of the participants. He developed candlestick charts to record and analyze prices, thereby predicting trends and achieving great financial success. In the 20th century, Steve Nison – an American analyst – popularized Japanese candlesticks to the Western world through the book Japanese Candlestick Charting Techniques. Since then, Japanese candlesticks have become an indispensable tool in global trading.
How to read a single candlestick
Reading one candlestick helps traders understand the balance between buyers and sellers in a given session.
- A green or white candle means the price closed higher than it opened, showing buying strength.
- A red or black candle means the price closed lower than it opened, showing selling pressure.
The candle’s size and wick length reveal how volatile the session was; long wicks show strong price rejections, while a small body signals indecision.
Types of candlestick patterns
Candlestick pattern are divided into single candlestick patterns and multiple candlestick patterns. Each type of pattern can suggest different trends or signals.
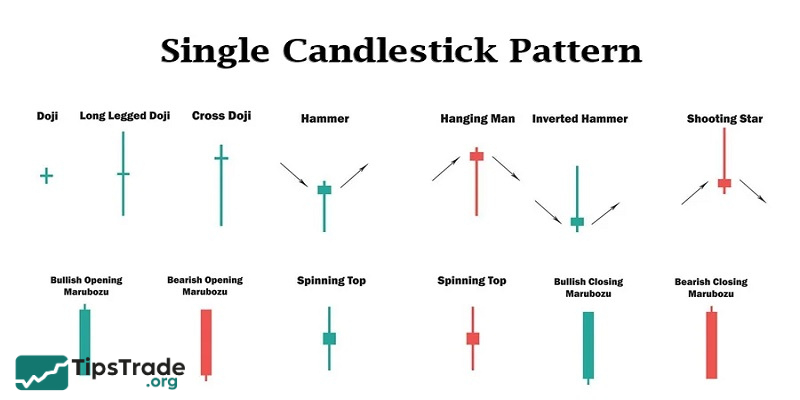
Single candlestick patterns
Single candlestick pattern capture key signals from individual trading periods, thus providing a closer, more detailed view of financial market sentiment. In general, these patterns show short-term changes in buyer and seller activity.
- Hammer: The small candle body is located near the top, with a long lower shadow. This pattern shows that there was strong selling pressure but the price recovered before the end of the trading session.
- Doji: A candle with a very small body. A Doji candle shows that the opening and closing prices are almost equal, and this is usually a sign of indecision in the market.
- Shooting Star: The small candle body is located near the bottom, with a long upper shadow. This pattern means that the price increased during the trading session, but was eventually pushed back.
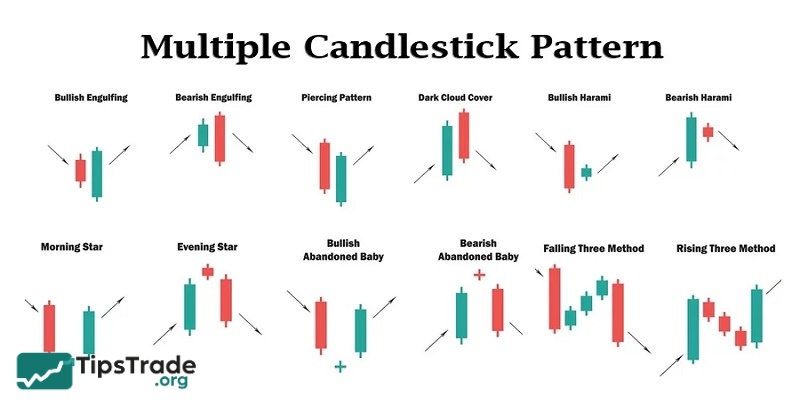
Multiple candlestick patterns
Multiple candlestick patterns cover a series of trading sessions (periods) to examine trends and changes that are occurring over time.
- Engulfing: A small candle is followed by a larger candle that completely engulfs it. A bullish engulfing pattern usually means that the uptrend is strengthening, while a bearish engulfing pattern indicates a potential downtrend.
- Morning Star: A three-candle pattern that signals a reversal of a downtrend. This pattern is considered bullish, meaning the market is shifting from selling pressure to buying interest.
- Evening Star: A three-candle pattern that shows that the bullish momentum is fading. In contrast to the Morning Star, this pattern is considered bearish and could mean that the market is about to enter a decline.
- Three White Soldiers: Three consecutive bullish candles. This combination means there is persistent buying pressure and a strong uptrend.
- Three Black Crows: Three consecutive bearish candles. This pattern reflects persistent selling pressure and could mean the downtrend will continue.
How to use candlestick patterns in trading
Candlestick patterns serve as a supporting tool, not a “crystal ball.” Here’s how to apply it effectively:
- Identify the trend: Use Marubozu, Three White Soldiers to identify uptrend; Three Black Crows, Bearish Engulfing for downtrend.
- Find the reversal point: Combine Hammer, Shooting Star, Harami with support/resistance zone, wait for confirmation from the next candle.
- Risk management: Place stop loss below Hammer shadow or above Shooting Star shadow, calculate R:R ratio at least 1:2.
- Combine other tools: Use moving average (MA), RSI, Fibonacci to increase reliability.
Benefits and limitations of candlestick patterns
Here are some benefits and limitations of trading with candlestick patterns that you need to know:
Benefits of candlestick patterns
- Clear visual representation: Candlestick patterns provide investors with a simple, intuitive and logical way to evaluate the market.
- Easy to spot trends: Familiar candlestick patterns like the Hammer or Doji make it easy to know when a trend reversal or continuation is likely, allowing traders to react quickly.
- Simplicity: The easy-to-understand design of candlestick charts makes them accessible, even to investors new to technical analysis.
- Provide in-depth information: Combining the open, high, low and close prices in one image helps investors understand the balance between buying pressure and selling pressure in trading.
Limitations of candlestick patterns
- Potential for false signals: In volatile or sideways markets, candlestick pattern can sometimes be misleading.
- Historical data: These patterns reflect past price movements and may not reliably predict future market behavior.
- Timeframe sensitive: Depending on the timescale of the chart, the accuracy of candlestick pattern may vary.
- Confirmation required: Candlestick patterns can be misinterpreted, so it is important to check other technical indicators as well.
In short, candlestick patterns help investors understand what is happening in the market. These patterns can suggest when trends may change, and traders can improve their strategies by looking at different candlestick combinations. However, it is important to use other tools to manage investment risk and make smarter trading decisions.
Conclusion
The above is the most detailed summary of candlestick patterns that Tipstrade.org has compiled. Hopefully, this article will provide you with useful knowledge about candlestick patterns, thereby making it easier for you to invest in finance. Good luck!