
Fundamental vs technical analysis represents two primary approaches investors use to evaluate stocks. Fundamental analysis focuses on a company’s financial health, market position, and economic factors. In contrast, technical analysis studies price patterns and market trends to predict future movements. Understanding the differences between these methods helps investors choose the most suitable strategy for their goals. Visit tipstrade.org and check out the article below for further information
What Is Fundamental Analysis?

Definition and Core Principles
- Fundamental analysis (FA) is a method used to evaluate the intrinsic value of a financial asset — such as a stock, bond, or cryptocurrency — by studying related economic, financial, and qualitative factors.
- The goal is to determine whether the current market price accurately reflects the asset’s true worth.
- This method assumes that prices eventually align with intrinsic value.
- If an analyst determines that a stock is undervalued compared to its fundamental worth, they might buy it, expecting the price to rise over time.
- For example, an investor might analyze Apple Inc. (AAPL) by studying its financial statements, revenue growth, profit margins, and competitive advantages.
- If Apple’s stock trades below what the data suggests it should be worth, it becomes a buy opportunity.
- In short, fundamental analysis tells investors what to buy by answering the question: “Is this asset fundamentally sound?”
See more:
- Impact of Macroeconomic Factors on Stocks
- What is bid ask spread? Factors that influence bid ask spread
- Fundamental Analysis Stocks: Everything Investors Need to Know
- Technical Analysis for Stocks: The Complete Guide for Modern Investors
Key Components and Metrics of Fundamental Analysis

Fundamental analysis can be divided into quantitative and qualitative elements:
Quantitative Factors
These are measurable financial indicators derived from company reports:
- Earnings per Share (EPS) – Indicates a company’s profitability per share.
- Price-to-Earnings Ratio (P/E) – Shows how much investors are willing to pay per dollar of earnings.
- Debt-to-Equity Ratio (D/E) – Measures leverage and financial stability.
- Return on Equity (ROE) – Evaluates management efficiency.
- Cash Flow Analysis – Reveals how much actual cash the business generates.
For instance, according to Morningstar (2024), companies with consistent positive free cash flow outperform peers over the long term.
Qualitative Factors
These are intangible elements that affect future growth:
- Management Quality – Leadership vision and governance.
- Brand Value & Competitive Advantage – A “moat” that protects profits (e.g., Coca-Cola’s global brand).
- Industry Trends – Technology, demographics, or regulation shifts.
- Macroeconomic Conditions – Interest rates, GDP growth, inflation.
Together, these factors provide a holistic picture of a company’s value and potential for sustainable growth.
Strengths and Limitations of Fundamental Analysis
| Strengths | Limitations |
| Provides long-term insight into company value | Ineffective for short-term trading |
| Based on real, measurable data | Requires deep research and expertise |
| Helps avoid emotional decision-making | Market prices can deviate from fundamentals for long periods |
| Ideal for value and income investors | May miss timing opportunities |
Example:
Warren Buffett built his empire using fundamental analysis, focusing on companies with strong earnings, good management, and lasting competitive advantages. Yet even Buffett admits markets can stay irrational — meaning fundamentals don’t always dictate short-term prices.
What Is Technical Analysis?
Definition and Core Principles
- Technical analysis (TA) focuses on studying past market data — mainly price and volume — to forecast future movements.
- The core belief is that market prices reflect all available information, and price action tends to repeat due to human psychology.
- Unlike fundamental analysis, which values what to buy, technical analysis tells you when to buy or sell.
For example, a trader might observe a bullish breakout pattern on Tesla’s daily chart. Even without reviewing Tesla’s balance sheet, they may buy based on signals suggesting strong momentum.
Common Tools and Indicators in Technical Analysis
Technical analysts rely on various indicators and charting techniques to detect trends and reversals. Some of the most popular include:
Trend Indicators
- Moving Averages (MA): Show the direction of the trend and filter noise.
- Example: A “Golden Cross” (50-day MA crossing above 200-day MA) often signals bullish momentum.
- Moving Average Convergence Divergence (MACD): Measures momentum and trend strength.
Momentum Indicators
- Relative Strength Index (RSI): Ranges from 0–100 to indicate overbought (>70) or oversold (<30) conditions.
- Stochastic Oscillator: Compares closing price to price range over time to predict reversals.
Volume Indicators
- On-Balance Volume (OBV): Tracks buying/selling pressure through volume movement.
- Volume Profile: Highlights price levels with the most traded activity.
Technical analysis also includes chart patterns (e.g., head-and-shoulders, double tops, triangles) and candlestick formations (e.g., doji, engulfing) to visualize market psychology.
Strengths and Limitations of Technical Analysis
| Strengths | Limitations |
| Great for identifying short-term opportunities | Doesn’t consider company fundamentals |
| Useful in highly liquid markets | Can generate false signals |
| Visual and data-driven | Subject to trader bias |
| Adaptable across multiple assets | Less effective in low-volume or manipulated markets |
Example:
A forex trader may use RSI and MACD to detect oversold EUR/USD conditions. While this may yield quick profits, ignoring broader macroeconomic data (like ECB policy changes) could lead to unexpected losses — a limitation of relying solely on technicals.
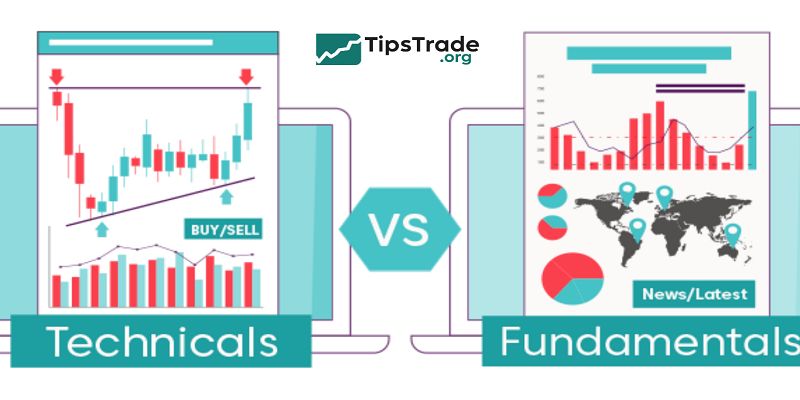
Fundamental vs Technical Analysis
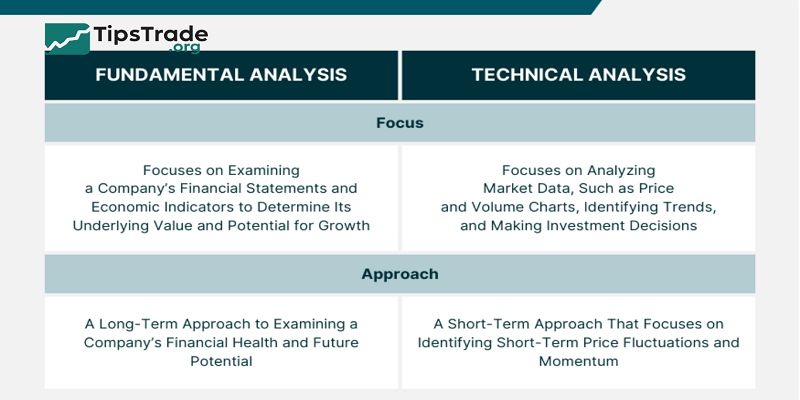
Below is a side-by-side overview to help you see how both methods differ and complement each other:
| Aspect | Fundamental Analysis | Technical Analysis |
| Main Focus | Intrinsic value of the asset | Price trends and patterns |
| Data Sources | Financial statements, macroeconomics | Price charts, volume data |
| Time Horizon | Long-term (months–years) | Short-term (minutes–days) |
| User Type | Investors | Traders |
| Decision Basis | Business fundamentals | Market psychology |
| Example Strategy | Buy undervalued stock | Trade breakout or reversal pattern |
| Ideal Market Condition | Stable or growth markets | Volatile or trending markets |
A 2023 study by the CFA Institute found that investors who combined both methods achieved 15–20 % higher portfolio consistency than those using only one approach.
In essence:
- Fundamental analysis tells you what to buy.
- Technical analysis tells you when to buy.
Combining Fundamental and Technical Analysis
Why You Should Combine Both
In real-world investing, using both methods provides a balanced perspective.
- Fundamental analysis helps identify quality assets.
- Technical analysis helps time entries and exits to optimize performance.
This combination reduces risk by avoiding overpriced assets and mistimed trades. Institutional investors and hedge funds often employ analysts specialized in both domains for this reason.
Example: A Practical Hybrid Approach
Imagine you’re evaluating Microsoft (MSFT):
- Step 1 – Fundamental Screening: You find strong revenue growth (up 12 % YoY), rising cloud profits, and low debt — all bullish fundamentals.
- Step 2 – Technical Confirmation: The stock forms a bullish ascending triangle on the chart, with RSI at 55 (neutral momentum) and 50-day MA trending upward.
- Step 3 – Execution: You wait for a confirmed breakout above resistance before entering — combining both insights to lower risk.
This method aligns long-term conviction with short-term precision.
Best Practices for Integration
- Use FA for stock selection, TA for timing.
- Set risk parameters (stop-loss, take-profit) using chart support/resistance.
- Stay consistent — don’t mix short-term trading mindset with long-term investment decisions.
- Back test strategies before applying real money.
- Review periodically as fundamentals and price dynamics evolve.
This dual-approach mindset represents how modern investors, including professionals at firms like BlackRock and Fidelity, optimize decision-making.
When to Use Each Method
| Scenario | Recommended Approach | Rationale |
| Long-term retirement investing | Fundamental Analysis | Focus on value and growth stability |
| Day trading or swing trading | Technical Analysis | Short-term price patterns are key |
| Market timing for entry points | Technical Analysis | Chart signals aid precision |
| Evaluating company health | Fundamental Analysis | Requires in-depth financial insight |
| Volatile markets (e.g., crypto) | Combination of Both | Fundamentals provide context, TA manages timing |
Knowing when to apply each helps prevent emotional and inconsistent trading.
Common Mistakes to Avoid
- Ignoring Risk Management – Even accurate analysis fails without stop-losses or diversification.
- Overfitting Indicators – Using too many technical indicators causes confusion and lagging signals.
- Overconfidence in One Method – Blind faith in only FA or TA narrows perspective.
- Neglecting Macro Events – Economic shifts (like interest rate hikes) can invalidate both analyses.
- Failing to Review Results – Consistent evaluation refines accuracy and confidence.
Conclusion
Fundamental vs technical analysis both offer valuable insights, but each has its strengths and limitations. Combining these approaches can provide a comprehensive view of the market. Investors who understand when and how to apply each method are better equipped to make informed decisions and optimize their investment outcomes.
>>See more: