

MACD Stock is a powerful technical analysis tool used by traders and investors to identify changes in the strength, direction, momentum, and duration of a stock’s price trend. This comparison helps reveal buy and sell signals based on crossovers, divergences, and momentum shifts. With its ability to indicate potential trend reversals and confirm the strength of ongoing trends, the MACD is widely regarded as an essential indicator for timing entry and exit points in stock trading. Visit tipstrade.org and check out the article below for further information
What Is MACD Stock?
- The MACD, or Moving Average Convergence Divergence, measures the relationship between two exponential moving averages (EMAs).
- It helps traders visualize when short-term momentum is gaining or losing relative to longer-term trends.
- The MACD Line is calculated by subtracting the 26-period EMA from the 12-period EMA: MACD Line = EMA(12) – EMA(26)
- A 9-period EMA of this MACD line, called the Signal Line, is then plotted to generate trading signals.
- The difference between these two lines is shown as a histogram, illustrating the distance or “momentum strength” between them.
How the MACD Stock Works
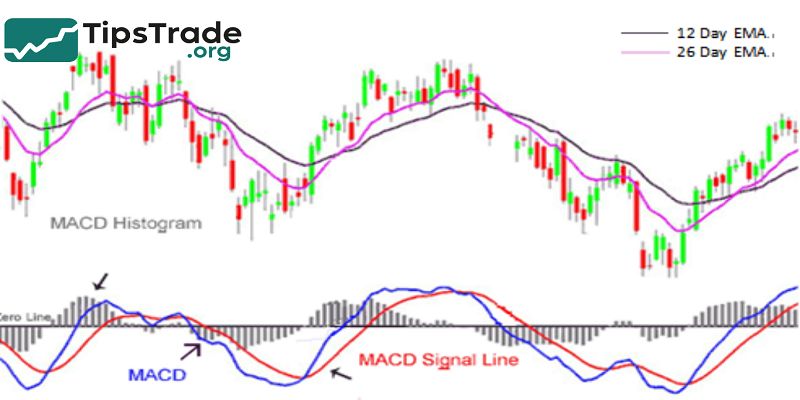
- MACD is based on the relationship between two exponential moving averages (EMAs): usually the 12-day and 26-day EMAs.
- The MACD line is calculated by subtracting the 26-day EMA from the 12-day EMA: MACD line = EMA(12) – EMA(26).
- When the short-term EMA (12) moves faster than the long-term EMA (26), the MACD line rises, indicating increasing bullish momentum. When it falls below, it signals weakening momentum and possible bearish conditions.
- A signal line — typically a 9-day EMA of the MACD line — is plotted on the graph. Crossovers of the MACD line above the signal line are considered bullish signals, and crossovers below are bearish signals.
- The histogram visualizes the distance between the MACD line and the signal line. When the MACD crosses above the signal line, the histogram turns positive (above zero), suggesting upward momentum.
- When it crosses below, the histogram turns negative, indicating downward momentum.
Key Signals and Uses
- Crossovers: When the MACD line crosses above the signal line, it’s a buy signal; when it crosses below, it’s a sell signal.
- Zero line crossings: MACD crossing above zero indicates a bullish trend, while crossing below signals a bearish trend.
- Divergences: When the MACD forms higher lows while the price forms lower lows, it signals weakening downward momentum, potentially leading to a reversal.
- Trend strength: The distance of the MACD from zero line shows the strength of the trend, with larger distances indicating stronger momentum.
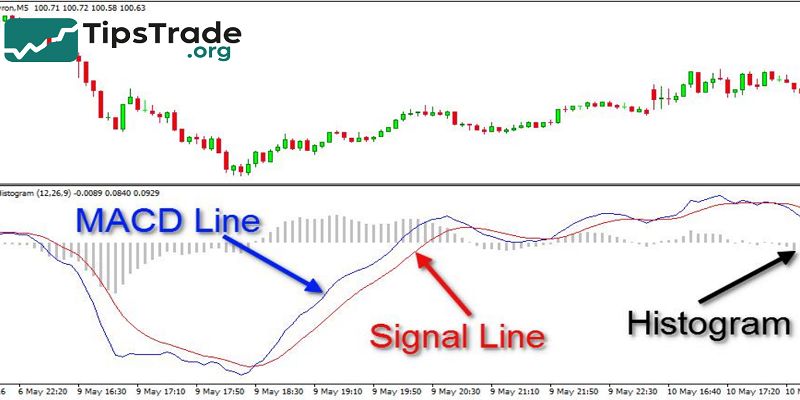
Components of MACD
- MACD Line – Shows the difference between the two EMAs.
- Signal Line – A smoothed version of the MACD line that triggers buy/sell signals.
- Histogram – Represents the gap between MACD and Signal lines; a growing histogram shows increasing momentum.
How to Read MACD Signals
Signal Line Crossovers
- A bullish crossover occurs when the MACD line moves above the signal line, indicating that short-term momentum is overtaking long-term momentum — a potential buy signal.
- Conversely, a bearish crossover happens when the MACD line drops below the signal line, hinting at a possible trend reversal or selling opportunity.
- For example, when MACD crossed above its signal line on AAPL’s daily chart in April 2024, the stock gained 12% in two weeks before momentum slowed again.
- Such signals, when confirmed by volume and trend strength, can be valuable.
Zero-Line Cross
- When the MACD line moves above the zero line, it suggests that the short-term EMA is now higher than the long-term EMA — a sign of upward momentum.
- Falling below zero implies downward momentum.
- Zero-line crossovers often confirm larger trend shifts, making them useful for position traders and swing traders.
Divergences
A divergence happens when the stock price moves in the opposite direction of the MACD.
- Bullish divergence: Price makes lower lows, but MACD makes higher lows — potential trend reversal upward.
- Bearish divergence: Price makes higher highs, but MACD makes lower highs — possible weakening of bullish momentum.
- Divergences are strongest when confirmed by declining volume or other indicators like RSI.
MACD Settings and Customization
Default vs. Custom Settings
The standard MACD parameters (12, 26, 9) were originally designed for daily charts of U.S. equities. However, traders can fine-tune these settings:
- Shorter EMAs (e.g., 8, 21, 5) → more sensitive to price changes; suited for intraday trading.
- Longer EMAs (e.g., 19, 39, 9) → smoother signals; ideal for long-term investors.
Choosing Timeframes
- Intraday traders (1-hour, 15-minute charts): Use faster settings like (6, 19, 5).
- Swing traders (daily charts): Default (12, 26, 9) works best.
- Position investors (weekly/monthly): Slower settings such as (19, 39, 9) filter out noise.
Platform Setup
- MACD is available on nearly every trading platform — TradingView, MetaTrader 5, ThinkorSwim, and Fidelity Active Trader Pro.
- Each allows you to visualize crossovers, histograms, and divergences in real time.
Trading Strategies Using MACD

Trend-Following Strategy
- Buy when MACD crosses above the signal line and both are above zero.
- Sell when MACD crosses below the signal line and both are below zero.
- This strategy captures momentum in trending markets but can underperform in sideways periods.
Reversal Strategy
Use MACD divergence to spot potential reversals:
- A stock forms a lower low while MACD forms a higher low → potential bullish reversal.
- A stock forms a higher high while MACD forms a lower high → potential bearish reversal.
Breakout Confirmation
- Combine MACD with price patterns such as triangles or channels.
- For instance, when TSLA broke out of a consolidation pattern in February 2025, MACD crossed above its signal line, confirming renewed momentum.
Multi-Indicator Approach
- MACD + RSI: RSI detects overbought/oversold conditions; MACD confirms trend strength.
- MACD + Volume: Strong MACD crossovers with increasing volume indicate robust moves.
- MACD + Moving Averages: Reinforces confirmation of broader trend direction.
Advantages and disadvantages of MACD

Strengths
- Versatile: Works across stocks, ETFs, indices, and even crypto markets.
- Visual clarity: The histogram quickly reveals momentum acceleration or deceleration.
- Compatibility: Integrates easily with other technical indicators.
Weaknesses
- Lagging indicator: Based on moving averages, MACD reacts after price movement.
- False signals: Especially common during sideways or low-volume conditions.
- Not predictive: It measures momentum, not future price levels.
How to Reduce False Signals
- Trade only in trending markets.
- Confirm with volume analysis and longer-term charts.
- Combine with leading indicators like RSI or stochastic oscillator.
Comparing MACD with Other Indicators
| Indicator | Type | Strength | Weakness | Best Used For |
| MACD | Momentum/Trend | Confirms momentum shifts | Lagging in sideways markets | Trend identification |
| RSI | Oscillator | Identifies overbought/oversold | May signal early | Entry timing |
| Stochastic | Oscillator | Fast signals in ranges | Too sensitive in trends | Range trading |
| Moving Average | Trend | Simple trend visualization | Delayed reaction | Support/resistance |
Combining MACD with RSI or volume metrics often improves trade accuracy while maintaining manageable signal frequency.
Practical Example: Using MACD in Stock Trading
Example 1 – AAPL (Apple Inc.)
- In June 2024, AAPL’s MACD line crossed above the signal line while the histogram turned positive.
- Within two weeks, the stock gained 8% as bullish momentum grew. The move was further confirmed by increasing trading volume and an RSI above 55.
Example 2 – FTSE 100 Stock
- A large U.K. industrial stock showed a bearish divergence: price hit higher highs while MACD flattened.
- A few sessions later, the stock reversed 5%, validating the early momentum signal.
Example 3 – Asian Market (Nikkei 225 Component)
- Japanese equities often trend smoothly; here, the MACD zero-line cross helped confirm a multi-week breakout.
- This case demonstrates MACD’s global adaptability across markets and time zones.
Conclusion
The MACD remains one of the most powerful and accessible technical indicators for stock traders worldwide. Its ability to visualize momentum and confirm trends makes it invaluable — but like all tools, its effectiveness depends on disciplined application and context. By mastering crossovers, divergences, and multi-timeframe analysis, traders can turn the MACD from a simple indicator into a strategic decision-making asset. Use it wisely, test it thoroughly, and always pair it with sound risk management — that’s how the MACD becomes more than just a line on a chart; it becomes part of a winning trading framework.