

Breakout trading is one of the most popular yet misunderstood strategies among traders across markets. Whether in stocks, forex, or cryptocurrencies, a “breakout” occurs when the price moves beyond a defined support or resistance level — signaling potential momentum in the direction of the breakout. This concept appeals to active traders because it seeks to capture large moves early, right as a new trend begins. Visit tipstrade.org and check out the article below for further information
What Is a Breakout Tranding?
- A breakout occurs when price decisively moves outside a consolidation area — either above resistance or below support — accompanied by strong trading volume.
- It signals a shift in market sentiment: buyers overpower sellers in an upside breakout, or vice versa in a downside breakout.
- Successful breakout traders aim to catch these early directional moves before the majority joins the trend.
- According to Investopedia, breakouts mark the potential start of new volatility phases and can serve as entry points for both trend followers and swing traders.
- Recognizing the psychology behind a breakout — trapped traders rushing to exit, and new entrants piling in — helps explain why these moves often accelerate quickly.
See more:
- IPO Process: Step-by-Step Guide to Going Public
- How To Buy Stocks in 4 Steps: Quick-Start Guide for Beginners
- Long-Term Stock Investing: Benefits and Key Principles to Understand
- Day Trading Stocks: Benefits, Risks, and Effective Investing Strategies
Types of Breakouts
There are three common breakout categories:
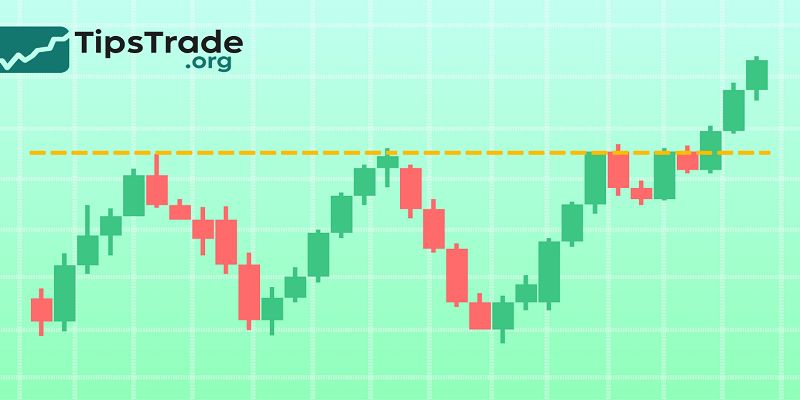
- Horizontal Breakouts: Price moves above resistance or below support from a sideways range.
- Trendline Breakouts: Price pierces a dynamic boundary connecting highs or lows in a trend.
- Pattern Breakouts: Occur when classic chart formations (triangles, flags, rectangles) resolve in one direction.
- Across markets, pattern breakouts like ascending triangles or bullish flags often precede strong rallies.
- However, traders must confirm moves with volume or volatility expansion to avoid false signals — a lesson consistently reinforced in CME and CMT Association research on technical reliability.
Market Psychology Behind Breakouts
- Breakouts happen because of emotional pressure building during consolidation.
- Traders become impatient, stop orders accumulate, and once the price escapes the range, liquidity gaps accelerate momentum.
- For example, in crypto markets, consolidation zones often attract algorithmic traders setting breakout triggers.
- Once breached, algorithms amplify the move by auto-executing long or short orders.
- Recognizing this collective behavior helps explain why breakouts in high-volatility assets like Bitcoin can be explosive compared to slow-moving blue-chip stocks.
Preparing for a Breakout Setup

Identifying Key Support and Resistance Zones
Before a breakout can occur, traders must map critical support and resistance levels. These zones represent areas where supply and demand were previously balanced.
Tools to define them include:
- Horizontal price clusters — previous highs/lows.
- Moving averages — dynamic levels of interest.
- Volume profile or VWAP zones — institutional price memory.
- In forex, resistance levels often align with round numbers (e.g., 1.1000 EUR/USD), while in stocks, prior earnings-related highs can act as strong barriers.
- Charting software like TradingView and MetaTrader makes visual identification efficient.
Using Volume as Confirmation
- Volume serves as the heartbeat of a breakout. High relative volume validates that institutional money supports the move.
- For instance, a stock breaking resistance on volume 50 % above its 20-day average is statistically more likely to sustain momentum (source: NASDAQ Market Intelligence, 2024).
- Conversely, low-volume breakouts frequently fail, trapping retail traders.
- Crypto traders often rely on the On-Balance Volume (OBV) indicator or Volume Oscillator to confirm strength, while futures traders track order-flow data from CME’s Depth-of-Market tools to spot genuine demand surges.
Multi-Timeframe and Market Context
- A breakout on a lower timeframe (e.g., 15 minutes) is more reliable when aligned with higher-timeframe trends (daily or weekly).
- Cross-market confirmation also matters: a breakout in Bitcoin is stronger if Ethereum or broader crypto indices confirm the move.
- In stocks, sectoral strength (e.g., the entire tech sector breaking higher) adds conviction.
- This alignment concept — called top-down confluence — helps traders avoid noise and focus only on setups where market structure supports continuation.
Common Breakout Strategies
Classic Breakout Entry
- The traditional method involves entering once price closes beyond resistance (for a long) or below support (for a short).
- Traders often set a stop loss just inside the broken level to minimize risk if the move reverses.
- Example: If the S&P 500 breaks above 4,500 after weeks of consolidation with rising volume, a trader may buy at 4,510 and set a stop near 4,470.
- This strategy works best in trending markets, not choppy ranges.
- Traders can enhance accuracy by combining moving averages (20-EMA/50-EMA) and RSI divergence to confirm momentum.
Retest or Pullback Breakout
- A conservative variation waits for the price to retest the broken level — confirming old resistance turning into support.
- This “confirmation entry” offers tighter stop placement and reduces false breakouts.
In forex, such retests often occur within hours; in equities, they might take days. - Data from DailyFX (2023) suggests pullback entries improve win rates by 15 % compared to immediate breakouts, though profits per trade tend to be smaller due to delayed entries.
Volatility and News Breakouts
- Volatility breakouts arise during major economic releases or earnings events.
- For instance, non-farm payrolls in forex or quarterly reports in stocks can cause sudden range expansions.
- Professional traders use Average True Range (ATR) filters to gauge breakout thresholds.
- However, risk management is crucial — spreads widen during news, and slippage can erode profits.
- Automated trading systems often combine volatility filters with breakout logic to avoid unpredictable conditions.
Tools and Indicators for Breakout Traders
Moving Averages and Trend Filters
- Moving averages smooth noise and confirm the dominant trend.
- A breakout above both the 50- and 200-day MAs implies bullish momentum
- The “Golden Cross” (50 MA crossing above 200 MA) often triggers breakout buying in equities.
- In crypto, similar crossovers on shorter timeframes (20/50 EMA) are popular among swing traders.
Bollinger Bands and Keltner Channels
- These volatility-based indicators visually highlight potential breakouts.
- When Bollinger Bands contract (low volatility) and price suddenly closes outside the band, it signals volatility expansion — often the beginning of a breakout phase.
- Keltner Channels provide smoother boundaries; when the Bollinger Band width exceeds Keltner width (a “squeeze”), it foreshadows explosive moves.
- John Bollinger’s research shows squeezes tend to precede 80 % of large volatility events in trending markets.
Volume Indicators
- On-Balance Volume (OBV) — detects volume accumulation before price moves.
- Volume Weighted Average Price (VWAP) — used by institutions to gauge fair value; breakouts above VWAP suggest buying strength.
- Money Flow Index (MFI) — combines price and volume to spot overbought/oversold breakout zones.
- Integrating at least one volume-based indicator helps traders filter weak signals and trade only momentum-backed breakouts.
Managing Risk and Trade Execution
Stop Loss and Take Profit Placement
- Every breakout strategy must define risk clearly.
- A common approach is setting the stop loss just inside the consolidation zone, usually 1 × ATR from the breakout level.
- Profit targets can be measured using pattern height (e.g., triangle base distance) or Fibonacci extensions.
- Maintaining a minimum risk-reward ratio of 1:2 ensures long-term profitability, even if win rates hover around 40 – 50 %.
Position Sizing and Leverage
- Breakout trading often involves rapid price expansion, tempting traders to over-leverage.
- Experts recommend risking no more than 1–2 % of capital per trade.
- For leveraged markets (forex × 30 , crypto × 10 ), using lower leverage and wider stops reduces premature liquidation.
- Professional funds employ “volatility targeting” — adjusting position size inversely to market volatility — to stabilize portfolio drawdowns.
Handling False Breakouts (Fakeouts)
False breakouts — when price briefly breaches a level and reverses — are the Achilles’ heel of this strategy.
Ways to mitigate fakeouts:
- Wait for candle close confirmation.
- Use volume surge or momentum indicator alignment.
- Combine breakout with retest setups.
- As per a 2024 CMT Journal study, filtering by 20 % above-average volume and waiting for a 2-bar close beyond resistance reduced fakeouts by 27 % across tested assets.
Comparing Breakout with Other Strategies
Breakout vs. Pullback Trading
- While breakout traders enter early at the start of a move, pullback traders wait for corrections within a trend.
- Breakouts offer faster potential profits but higher risk of whipsaws. Pullbacks yield steadier entries but may miss strong surges.
- Combining both — entering part position on breakout and adding after pullback — balances opportunity and safety.
Breakout vs. Mean-Reversion
- Mean-reversion traders bet on reversals toward averages, opposite to breakout logic.
- During low-volatility environments, mean-reversion works better. In high-momentum markets, breakout outperforms.
- Backtests from QuantConnect (2024) show breakout systems achieve higher returns when volatility percentile > 60 %, confirming their cyclical nature.
Multi-Market Application of Breakout Trading
Stock Market Examples
- Equities frequently experience breakouts during earnings seasons or sector rotations.
- For example, Nvidia’s 2024 breakout above $500 followed months of consolidation and triggered a 40 % rally, fueled by record volume.
- Traders monitor consolidation bases (“cup and handle,” “ascending triangle”) to anticipate similar setups.
- Institutional tools like MarketSmith or Finviz screeners help identify stocks approaching breakout zones.
Forex Market Examples
- Forex breakouts often align with macroeconomic releases — interest-rate decisions, CPI, or employment data.
- Pairs like GBP/USD or USD/JPY tend to form tight ranges before explosive sessions.
- Breakout traders use London session range breakouts or Asian range breakouts with clear volume spikes on high-impact news days.
- Professional FX desks rely on order-flow analytics to detect large stop clusters — natural fuel for breakout moves.
Crypto Market Examples
- Crypto assets, known for volatility, are fertile ground for breakout trading.
- Bitcoin’s multiple breakouts in 2025 above $70 k illustrated how on-chain data (exchange inflows, miner selling) can validate technical signals
- Traders integrate on-chain metrics like MVRV Ratio or Funding Rates with chart breakouts for confirmation.
- However, crypto’s 24/7 nature demands stricter risk control since overnight reversals can be violent.
Advantages and Drawbacks of Breakout Trading

Key Advantages
- Captures major trend beginnings with strong risk-reward potential.
- Objective rules — clear entry/exit points.
- Applicable to multiple markets and timeframes.
- Synergizes with algorithmic or quantitative systems.
Common Drawbacks
- High frequency of false signals in ranging markets.
- Requires patience during consolidations.
- Emotional pressure from rapid price swings.
- News volatility can distort setups.
How to Improve Consistency
- Consistency comes from focusing on quality over quantity.
- Traders should log each breakout setup, evaluate conditions (volume, context, pattern), and backtest across asset classes.
- Combining breakout criteria with momentum oscillators (e.g., MACD cross, ADX > 25) enhances precision.
- Long-term profitability arises not from predicting every breakout, but from managing losses and compounding small edges repeatedly.
Conclusion
Breakout trading remains a cornerstone of modern technical analysis — combining price action, psychology, and quantitative validation. Across stocks, forex, and crypto, the same principles apply: identify structure, confirm with volume, and execute with discipline. While no system guarantees success, breakout trading rewards those who master patience and risk control.