

Analyzing profitability ratios is one of the bases for managers to make financial or investment decisions that ensure the company’s profitability goals. So, what are profitability ratios and what ratios do they include? In the article below, Tipstrade.org will help you find answers to the above questions.
What are Profitability Ratios?
Profitability ratios are financial metrics used by managers to measure, analyze, and evaluate the profitability potential of a business compared to actual revenue, balance sheet, operating expenses, and shareholders’ equity over a certain period of time. Simply put, through Profitability ratios, we will understand the efficiency of a business in using assets to generate profits and maximize shareholder value.

>>See more:
- Fundamental Analysis Stocks: Everything Investors Need to Know
- What is Industry Comparison and How to do it?
- Key Stock Valuation Ratios and When to Use Which One
- What is bid ask spread? Factors that influence bid ask spread
Why are Profitability Ratios important?
Profitability ratios provide important information, offering a comprehensive view of how effectively a company uses its assets and equity to generate profits. At the same time, they also reflect the company’s level of operational cost control.
This is one of the most commonly used groups of financial indicators, as they provide insights from various perspectives. These ratios are used to assess the company’s ability to convert revenue into profit, as well as its profitability on assets and equity.

The different types of Profitability Ratios used in profitability analysis
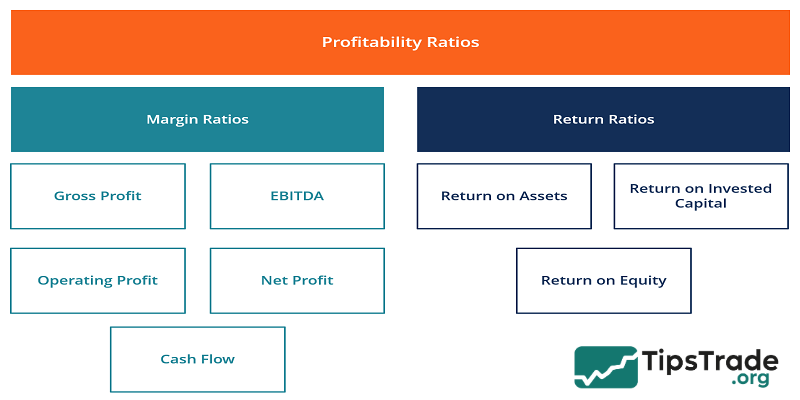
In fact, businesses can use many different types of profitability ratios to determine their financial status and operating efficiency. However, we can generalize them into two typical types of ratios as follows:
Margin Ratios
Margin ratios represent the company’s ability to convert sales into profits at various degrees of measurement.
Examples are gross profit margin, operating profit margin, net profit margin, cash flow margin, EBIT, EBITDA, EBITDAR, NOPAT, operating expense ratio, and overhead ratio.
Return Ratios
Return ratios represent the company’s ability to generate returns to its shareholders.
Examples include return on assets, return on equity, cash return on assets, return on debt, return on retained earnings, return on revenue, risk-adjusted return, return on invested capital, and return on capital employed.
The most common Profitability Ratios explained
As a group of important financial indicators in a company’s financial statements, from large to small, what are the common Profitability ratios and how are they calculated?
Gross Profit Margin
Gross profit margin reflects a company’s ability to generate profits from its operations. It shows whether the company is selling its products at a higher price than it actually costs. The higher the gross profit margin, the more money the company has left to cover its other expenses.
Gross profit margin is calculated by the following formula:
Gross Margin Ratio (%) = Gross Profit ÷ Net Revenue
Note that direct costs (seen in the Income Statement) include cost of goods sold (COGS), but not the cost of goods that have been produced but are still in stock (inventory).
It is rare to see negative gross margins at this level. Because if the cost of production is higher than the price customers are willing to pay, the business will be virtually unviable.

EBITDA Margin
EBITDA stands for Earnings Before Interest, Taxes, Depreciation, and Amortization. This indicator shows the profitability of a business before taking into account factors not directly related to business operations such as interest and taxes, as well as non-cash expenses such as depreciation and amortization.
EBITDA margin is calculated by the following formula:
EBITDA margin = (earnings before interest and tax + depreciation + amortization) / total revenue
The advantage of EBITDA margin analysis is that it allows for easy comparisons between businesses, because it excludes expenses that may be variable or discretionary.
However, the downside of EBITDA margin is that it can differ significantly from actual net profit and cash flow, which are more accurate indicators of a business’s operating performance.
EBITDA is widely used in many business valuation methods.

Operating Profit Margin
Operating profit margin, also known as earnings before interest and taxes (EBIT), reflects the profitability of a business model after taking into account production costs and operating expenses.
Operating profit margin is calculated by the following formula:
EBIT Margin Ratio (%) = Operating Income ÷ Net Revenue
The higher the operating profit margin, the more profit a business has (after taxes) to pay its financial obligations, reinvest in its operations, and pay dividends to its owners.
Note that the “other net income” line item in the Income Statement is below the EBIT line. This means that the related expenses are not part of the core business model and should not be included in operating profit.

Net Profit Margin
Is the business still profitable after all costs have been taken into account? The net profit margin will answer this question by measuring the overall profitability of the business. Net profit margin is the income that shareholders receive as their share of the dividend.
Net profit margin is calculated by the formula:
Net Profit Margin Ratio (%) = Net Income ÷ Revenue
The higher the net profit margin, the more resources a business has to reinvest and distribute profits to shareholders.

Cash Flow Margin
Cash flow margin shows the relationship between cash flow from operations and the revenue generated by the business. This ratio measures the ability of the business to convert revenue into cash.
Operating Cash Flow = Net Income + Non-cash Expenses (Depreciation and Amortization) + Change in Working Capital
A higher cash flow margin indicates that the business has more cash from sales to pay suppliers, dividends, utilities, debt, and purchase fixed assets. Conversely, a negative cash flow means that even though the business has sales or profits, it may still be running a cash deficit. In case of insufficient cash flow, the business may be forced to borrow capital or raise more from investors to maintain operations.

Return on Assets
Return on assets (ROA) looks at a company’s net income (return) relative to its total capital. In other words, it measures whether a business is generating enough profit relative to its size and the amount of capital it employs. A higher ROA indicates a more efficient use of capital.
Return on assets (ROA) is calculated by the formula:
ROA = Net income ÷ Average total assets
Alternatively, ROA can be calculated based on EBIT instead of net profit to get Operating ROA. The return on total assets does not consider the financial structure and costs of the business. Unlike net profit, EBIT includes interest expenses – a part of the financial structure. Therefore, Operating ROA provides a different perspective, showing the level of profitability of the business compared to the total assets it owns.
Operating ROA = EBIT ÷ Average total assets

Return on Equity
Return on equity (ROE) shows how much profit a company makes for its owners, or in other words, how much profit a company makes compared to the capital that shareholders have invested. A higher ROE shows that the company is more profitable, generating more profit to reinvest or pay dividends. From an investor’s perspective, this is one of the most important and frequently monitored profitability ratios.
Return on equity (ROE) is calculated by the formula:
ROE = Net Income / Shareholders’ Equity
Return on equity is an important measurement tool, often used as a starting point in financial analysis because it reflects the overall performance of the business. If this ratio is lower than the industry average, it indicates that the invested equity is not generating a high enough return or is lower than that of its industry competitors. To determine the cause, the ROE ratio can be decomposed using the DuPont framework.

Return on Invested Capital
Return on invested capital (ROIC) is a measure of the profit generated from the total capital raised by a business, including both shareholders and creditors (bondholders). This metric is similar to ROE, but is broader in scope because it takes into account the profit generated from all capital provided to the business, not just shareholders’ capital.
The simplified ROIC formula can be calculated as:
EBIT x (1 – tax rate) / (value of debt + value of + equity)
EBIT is used because it represents income generated before subtracting interest expenses, and therefore represents earnings that are available to all investors, not just to shareholders.

How to improve your Profitability Ratios
Profitability ratios can help you assess the overall financial health of your business. If you’re not yet satisfied with the financial indicators presented in the report, here are some strategies you can use to try to boost your company’s bottom line.
- Cut unprofitable products/services: Generally, businesses should focus on products/services that offer the highest profit margins. Eliminating underperforming products can help save costs and increase overall efficiency.
- Reduce inventory levels: Cutting slow-selling products not only helps reduce storage costs but also frees up capital, allowing businesses to invest in more profitable areas.
- Increasing selling prices: Adjusting prices can help improve profits, but it needs to be done carefully. Before implementing a mass price increase, test it on a few products or services to gauge market reaction.
- Reduce costs: Even if a business has high revenue, high costs can still decrease profit margins. There are many ways to save costs, such as negotiating better prices with suppliers, finding alternative sources, or renting out unused warehouse space.
- Attracting new customers: Typically, retaining existing customers is more cost-effective, but expanding your customer base can also help increase sales if managed properly. Additionally, when product prices are adjusted upwards, attracting new customers can help businesses adapt more easily to the new price level.

Limitations of Profitability Ratios
Profitability ratios are useful tools for assessing a company’s financial health, but experts are well aware of their limitations. Relying solely on these ratios can lead to misleading conclusions. Here are some of the main drawbacks:
- Industry specificity
Each industry has different profit standards. For example, software companies often have higher profit margins than steel manufacturers due to lower operating costs. Therefore, comparing profit ratios across industries is not reasonable. Investors should evaluate ratios in the same industry context to get a more accurate conclusion.
- Short-term focus
These ratios mainly reflect recent financial results, so they may ignore long-term trends, future growth prospects, or the impact of upcoming policies and investments. Therefore, they do not show the whole financial picture of the business.

- Impact of accounting adjustments
Profitability ratios can be affected by accounting methods. For example, a company may adjust costs through inventory valuation methods. Some companies may also delay the recognition of costs or record revenues early to smooth their profit reports. Therefore, it is important to consider a company’s accounting policies when analyzing.
- Limited scope
Profitability ratios use only income and expense data, so they lack the interpretation of underlying factors. A high profit ratio may look attractive, but without a clear understanding of cost structure, pricing strategy, and market trends, the analysis is incomplete.
Final thoughts
Profitability ratios are just one of many ratios in financial statements that investors need to consider. There are many other financial ratios beside those listed above. Learn more on Tipstrade.org’s website to stay updated with additional knowledge!
See more: