
Stock valuation ratios play a crucial role in helping investors assess the true value of stocks and make informed investment decisions. By analyzing different valuation ratios, investors can determine whether a stock is overvalued, undervalued, or fairly valued relative to the company’s potential. In this article, we will explore the most common key stock valuation ratios and when to use which one in the stock analysis process. Let’s get started!
What are stock valuation ratios?
Stock valuation ratios are financial metrics used to measure a company’s market value relative to its fundamental financial performance. These ratios help investors determine whether a stock is overvalued, undervalued, or fairly priced in the market.
In simple terms, valuation ratios compare a company’s stock price to its earnings, book value, sales, or dividends. By doing so, they provide insight into how the market perceives a company’s worth compared to its actual financial strength.

>>See more:
- What is Stock Valuation? Types & Methods
- P/E Ratio: The Complete Guide for Investors
- 1001 Stock Market Terms for Beginners Should Know
- Fundamental Analysis Stocks: Everything Investors Need to Know
The most common stock valuation ratios
Below are some of the most commonly used valuation ratios that any investor should understand and know how to use.
Price-to-Earnings (P/E) Ratio
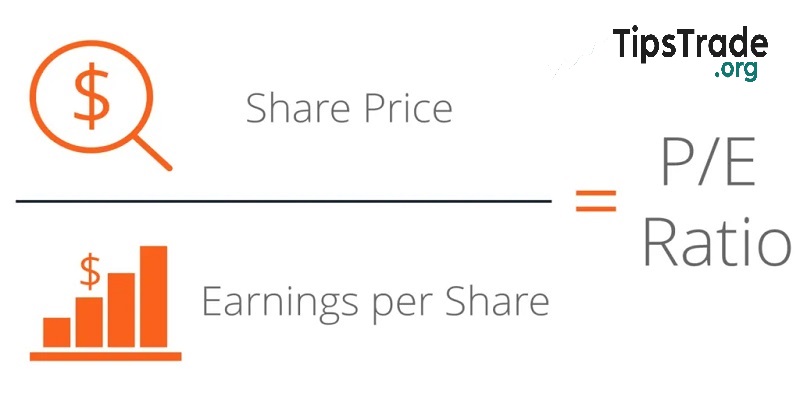
The price-to-earnings ratio (P/E ratio) shows the relationship between the price per share and the earnings (also known as net income – that is, revenue minus cost of goods sold, operating expenses, and taxes) per share. This ratio shows how much investors are willing to pay for $1 of a company’s earnings.
When to use P/E ratior
- Is the starting point for valuing most companies.
- When you want to quickly do a relative valuation analysis between different companies to see how the market is perceiving them.
Advantage
- Widely used: Since the P/E ratio is widely used, you can easily compare and contrast it with other stocks. In addition, it is more convenient to communicate with other investors because everyone has their own experiences or rules related to the P/E ratio.
- Easy to use: Both components of this ratio are fairly easy to find if you don’t need to adjust earnings figures. Current stock prices are easily found on Yahoo Finance, and earnings are the most commonly forecasted metric.
Disadvantages
- Easily manipulated: Profits are calculated using accrual accounting, so they can be affected by a variety of company adjustments. This is not necessarily fraudulent, but companies have more discretion in calculating this figure than they do with metrics like cash flow.
- Does not reflect the balance sheet: The P/E ratio does not take into account debt, so it does not fully represent a company’s financial health.
Price-to-Book (P/B) Ratio
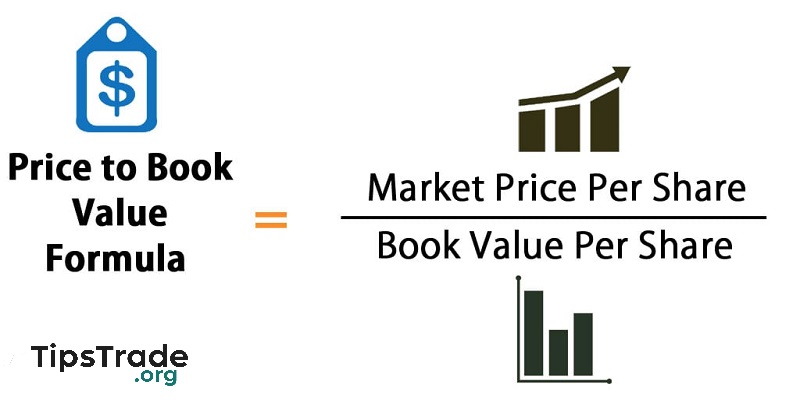
The price-to-book ratio (P/B) is the ratio of the stock price to the book value per share. Book value is the value of an asset recorded on the balance sheet – in other words, it is the remaining value of a company if it liquidates all its assets and pays off all its debts.
The P/B ratio reflects market sentiment regarding the relationship between the company’s required rate of return and its actual rate of return. A ratio > 1 indicates that the market believes the company’s future profitability will be higher than the required rate of return, assuming that book value accurately reflects the fair value of the assets.
When to use P/B
- Best suited for banks: Book value is typically more stable than earnings, while earnings can fluctuate wildly, making other ratios (like P/E) unstable.
- Useful when the company has negative profits: If a company has many negative profit periods, they can still maintain a positive book value, so the P/B ratio can still be used.
Advantage
- Stability index: Because book value is relatively stable, the P/B ratio is less volatile than other ratios such as P/E.
Disadvantages
- Differences in accounting make comparison difficult: This ratio becomes less useful when companies record assets and liabilities differently due to different interpretations of accounting standards. You should be careful when comparing businesses with similar business models, by comparing companies few tangible assets(such as a technology or service business) with a company have a lot of inventory or equipment(like retail or manufacturing) wouldn’t make much sense.
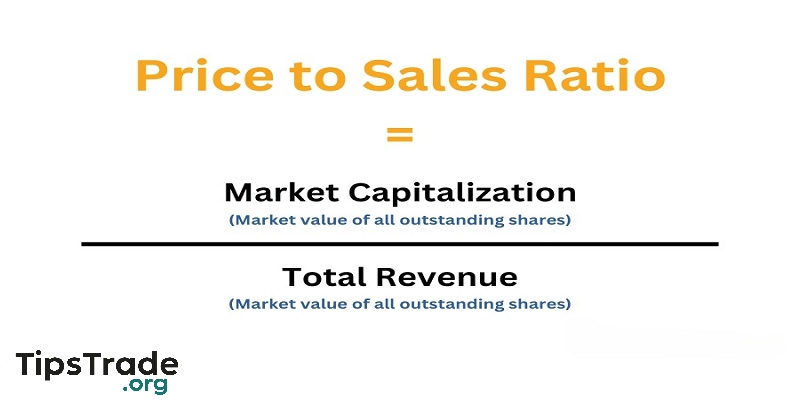
Price-to-Sales (P/S) Ratio
Price-to-Sales (P/S) ratio is calculated by stock price divided by earnings per share. While ratios like P/E (price to earnings) and P/B (price to book value) are generally more relevant to large companies with positive earnings,P/S ratiocommonly used toCompare the stock prices of companies that do not yet have positive net income, for example startups or businesses are facing difficultiesRevenue is the targetless dependent on accounting methods more than profit or book value.
When to use P/S
- Suitable for unprofitable companies, such as new businesses in the investment phase, or companies cycle like railways and airlines – industries that may experience temporary periods of loss.
Advantage
- Less affected by accounting tricks: A metric like book value requires consideration of accounting factors like depreciation and inventory valuation (which can sometimes make it difficult to compare accurately between businesses). Meanwhile, an index P/S is almost impossible to be “beautified” easily.
- Relatively stable index: Revenue is typically more stable than profits, which can fluctuate widely based on costs or other financial factors.
Disadvantages
- Does not reflect profitability: The P/S ratio does not consider the profit factor, so it does not clearly show the level of efficiency in the business operations of the enterprise.
Price-to-Cash Flow (P/CF) Ratio
The price-to-cash flow (P/CF) ratio measures the amount of cash flow a company generates relative to its market value.
The P/CF ratio is a good alternative to P/E because cash flow is less affected by accounting tricks than earnings. Cash flow excludes non-cash expenses such as depreciation and amortization, which are affected by different accounting rules when calculating earnings.
For example, a company with a stock price of $20 and cash flow per share of $5 would have a P/CF ratio of 4 (20/5). In other words, investors are paying $4 for every $1 of expected future cash flow.

When to use P/CF
- Especially useful for stocks that have positive cash flow but are not yet profitable.
Advantage
- Hard to manipulate: Cash flow is harder to manipulate than earnings because it is not based on accrual accounting. Cash is a more real, clear, and transparent number.
Disadvantages
- Difficult to predict future cash flows: While earnings or revenue forecasts can be easily found for free on sites like Zacks, cash flow estimates are often harder to access and require a subscription to a paid service like Bloomberg or FactSet.
- There are different ways to calculate cash flow: This makes comparisons between companies not truly equivalent, reducing the accuracy of the analysis.
Enterprise Value-to-EBITDA (EV/EBITDA) Ratio
The EV/EBITDA ratio is the ratio of enterprise value (EV) to earnings before interest, taxes, depreciation, and amortization (EBITDA).
Essentially, this ratio indicates how many times EBITDA an investor must pay to acquire the entire company (since EV represents the total value of equity plus debt minus cash). EBITDA is often considered a proxy for cash flow, although there is still some debate about the accuracy of this approach.
When to use EV/EBITDA: Good for capital intensive industries where balance sheets hide a lot of the funding – airlines, railroads,…
Advantage: Incorporates the balance sheet.
Disadvantages
- More difficult to compute: It takes more work to get to EBITDA (earnings before interest, taxes, depreciation, and amortization), and consensus estimates are not always readily available.
Why are stock valuation ratios important?
Stock valuation ratios are important tools that help investors and companies understand the true value of a stock. They provide insights into whether a company’s stock is fairly valued, overvalued, or undervalued. The importance of stock valuation ratios for investors and companies is presented below.
Importance of stock valuation ratios for investors
- Stock valuation ratios can help investors select stocks by comparing different stocks to find the best investment opportunity.
- These ratios help identify stocks that are overvalued or undervalued, and compare stocks within the same industry to assess which stocks are more attractively valued.
- Investors can use these ratios to make informed investment decisions, by analyzing the financial situation of the business instead of just relying on stock price fluctuations, thereby managing risks and achieving stable profits.
- These stock valuation ratios are useful for both growth and value investing strategies, as value investors typically look for stocks with low P/E and P/B ratios, while growth investors focus on Price-to-Earnings (P/S) ratios.

Importance of stock valuation ratios for companies
- A company with stock valuation ratios is more likely to attract investors looking for profitable opportunities.
- These ratios help in understanding the financial health and relative position of the company as compared to its peers.
- A company with strong stock valuation ratios can raise capital from investors or banks as well as have better insight and control over pricing strategies, cost management, and expansion plans
- Stock valuation ratios are most helpful for companies to evaluate potential mergers, acquisitions, or partnerships.

Where to get stock valuation ratios?
Collecting accurate and up-to-date stock valuation ratios is essential to performing effective financial analysis. Reliable sources of stock valuation ratios include:
- Financial statements
A company’s financial statements (including the income statement, balance sheet, and cash flow statement) provide the data needed to calculate a variety of stock valuation ratios. These reports are often available on the company’s website or in the U.S. Securities and Exchange Commission (SEC) website, but both sources have certain limitations. It is best to obtain financial statement data through professional financial data providers.
- Financial news website
Financial news sites often provide stock valuation ratios data, especially for public companies. Sites like Bloomberg, Reuters, and Yahoo Finance provide stock valuation ratios for a variety of stocks and financial instruments. However, it is important to note that these sites typically do not provide APIs or CSV access to the data.
- Stock exchanges
Stock exchanges may also provide stock valuation ratios data for companies listed on their exchanges. For example, the NYSE and NASDAQ often include valuation ratios in company filings and reports.
Final thoughts
The stock valuation ratios mentioned above are used to analyze the financial health of a company and also to assist in making investment decisions. However, these ratios should not be used in isolation as they may not accurately reflect the true value of the stock. Therefore, it is important to evaluate the stock based on a combination of these stock valuation ratios to get a more comprehensive and accurate picture of the financial health of the company and the true value of the stock.
See more: