Technical analysis for stocksis one of the most widely used approaches to understanding market behavior and making informed trading decisions. Unlike fundamental analysis, which focuses on a company’s financials, technical analysis studies price movements, trading volume, and market psychology to forecast potential trends. Whether you are a beginner or an experienced trader, mastering stock technical analysis can help you identify entry and exit points, minimize risks, and improve portfolio performance. The article above from Tipstrade.org has just provided you . We hope that you find it useful. Wishing you successful trading!
What Is Technical Analysis?

Definition and Core Principles
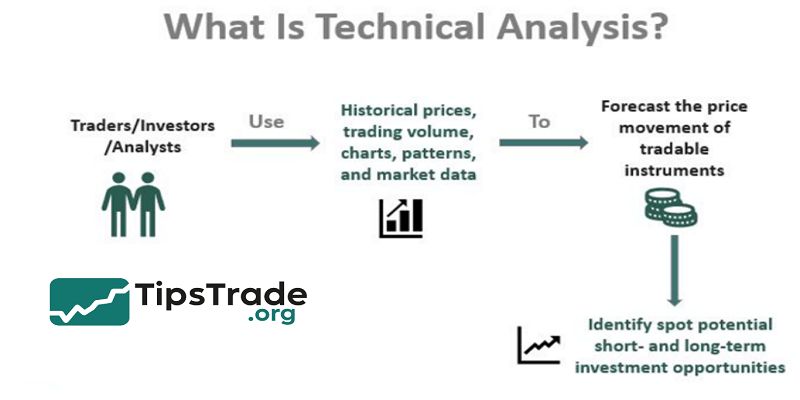
Technical analysis (TA) is a method of evaluating securities by analyzing historical price data and trading volume. The foundation of TA is built on three core assumptions:
- The market discounts everything — all known information (economic, political, and psychological factors) is already reflected in the stock price.
- Prices move in trends — once a trend is established, it is more likely to continue than reverse.
- History tends to repeat itself — investor behavior creates recurring patterns that can be recognized and utilized.
For example, during a bullish phase in the S&P 500, traders may use moving averages or RSI (Relative Strength Index) to confirm the continuation of the trend.
According to CMT Association research, more than 70% of professional traders incorporate at least one technical indicator in their trading system.
Technical vs Fundamental Analysis
- While fundamental analysis focuses on a company’s intrinsic value, technical analysis examines market sentiment.
- A fundamental investor might analyze earnings and P/E ratios, whereas a technical trader looks at chart patterns like head-and-shoulders or breakout levels to time entries.
A balanced investor often blends both — for instance, identifying undervalued stocks using fundamentals, then applying technical tools for optimal timing.
Time Frames in Stock Technical Analysis
Technical analysis is adaptable across different time horizons:
- Day traders analyze 1-minute to 15-minute charts.
- Swing traders prefer 1-hour to daily charts.
- Long-term investors may analyze weekly or monthly data to identify macro trends.
Choosing the right time frame depends on your strategy, risk tolerance, and capital allocation.
>> See more:
- What is Stock Liquidity? Why It’s Important for Investors
- What is Stock Market Index? Top 8 Stock Market Index You Should Know About
- What Is a Stock Broker? Essential Skills and Average Salary of Being a Stock Broker
- How To Read A Stock Chart: Exploring Key Types & Pro Tips
Core Components of Technical Analysis

Price and Volume
Price action reflects market psychology, while volume confirms the strength behind price moves.
- High volume on an uptrend suggests strong buying interest.
- Low volume on rallies may indicate weakness.
For example, when Tesla (TSLA) broke above $300 in 2023, analysts observed a 60% increase in average daily volume — confirming institutional accumulation.
Trend and Trendlines
Identifying trends is fundamental. Uptrends form higher highs and higher lows; downtrends create lower highs and lower lows.
Trendlines, when drawn correctly, visually represent market direction. Traders often use two or more touchpoints on a line to validate a trend.
| Trend Type | Key Signal | Example |
| Uptrend | Higher highs, higher lows | AAPL breaking 50-day MA |
| Downtrend | Lower highs, lower lows | META falling below 200-day MA |
| Sideways | Range-bound between support/resistance | NVDA consolidating near $1000 |
Support and Resistance
- Support is a price level where demand is strong enough to stop a decline, while resistance is where selling pressure prevents further rise.
- These levels are vital for setting entry, exit, and stop-loss points.
When support is broken, it often becomes new resistance — and vice versa.
Momentum and Oscillators
Momentum indicators measure the speed and strength of price movements. Popular oscillators include:
- RSI (Relative Strength Index): Measures overbought (>70) and oversold (<30) levels.
- MACD (Moving Average Convergence Divergence): Identifies trend reversals.
- Stochastic Oscillator: Compares closing price to recent highs/lows.
For instance, when RSI for Microsoft (MSFT) crosses above 70, traders might anticipate a short-term correction.
Moving Averages and Overlays
Moving averages smooth price fluctuations to highlight the trend direction.
- Simple Moving Average (SMA): Average of past prices over a set period.
- Exponential Moving Average (EMA): Gives more weight to recent prices. Crossovers between short-term and long-term MAs (e.g., 50-day vs. 200-day) often signal trend reversals — a “golden cross” (bullish) or “death cross” (bearish).
Popular Technical Indicators & Tools

RSI, MACD, and Stochastic
These oscillators are widely used for timing entries and exits.
- RSI detects momentum exhaustion.
- MACD captures crossover signals.
- Stochastic identifies momentum shifts before price reverses.
In a study by Financial Analysts Journal, traders using combined RSI-MACD strategies achieved 15% higher risk-adjusted returns compared to price-only systems.
Bollinger Bands, ATR, and ADX
- Bollinger Bands measure volatility — price touching upper/lower bands often signals overextension.
- ATR (Average True Range) quantifies volatility to set stop-loss distances.
- ADX (Average Directional Index) gauges trend strength (values above 25 indicate a strong trend).
Volume Indicators
Volume-based tools confirm participation.
- On-Balance Volume (OBV): Adds volume on up days, subtracts on down days.
- Accumulation/Distribution Line (A/D): Shows whether money is flowing into or out of a stock.
- These tools often precede price movements, signaling institutional buying before retail traders notice.
Fibonacci Retracement and Extensions
- Based on the Fibonacci sequence, retracement levels (23.6%, 38.2%, 61.8%) identify potential reversal zones
- Traders often combine these levels with trendlines or moving averages for confluence.
Advanced Indicators
Professional traders may use:
- Ichimoku Cloud: Offers multi-layered trend visualization.
- TRIX: A triple-smoothed momentum indicator filtering noise.
- Relative Rotation Graphs (RRG): Analyze sector strength versus benchmarks.
Chart Patterns and Price Action Strategies
Candlestick Patterns
Candlestick charts visualize open, high, low, and close prices — revealing sentiment shifts.
- Doji: Signals indecision.
- Hammer: Appears after a downtrend; suggests potential reversal.
- Engulfing: When a candle fully engulfs the previous one, signaling strong momentum change.
Classic Chart Patterns
Timeless formations reflect human psychology:
- Head and Shoulders: Predicts reversal from uptrend to downtrend.
- Double Top/Bottom: Marks major reversal levels.
- Triangles (Symmetrical, Ascending, Descending): Indicate continuation or breakout potential.
- Cup and Handle: Popularized by William O’Neil as a bullish continuation pattern.
Price Action Strategies
Experienced traders rely on naked charts — interpreting price behavior without indicators.
Common strategies:
- Breakout trading: Enter when price surpasses key resistance.
- Pullback trading: Join existing trends after retracement.
- Reversal trading: Trade against exhausted moves confirmed by divergence (e.g., RSI divergence).
Wyckoff Method and Market Phases
- Richard D. Wyckoff’s theory divides markets into accumulation, markup, distribution, and markdown phases
- Smart money often accumulates when the public sells — highlighting the importance of volume + structure analysis.
Building a Technical Trading Strategy

Combining Indicators
No single indicator guarantees accuracy. Traders improve success by combining trend, momentum, and volume tools.
Example setup:
- Identify trend using 50-day MA
- Confirm strength with RSI and ADX
- Validate volume with OBV
- This multi-confirmation approach reduces false signals.
Risk Management
Even the best analysis fails without discipline. Key rules:
- Risk ≤ 2% per trade.
- Use stop-loss based on volatility (ATR).
- Diversify positions and avoid correlation overlap.
Successful technical traders prioritize capital preservation over profit chasing.
Backtesting and Optimization
- Before deploying a system, test it with historical data.
- Backtesting helps evaluate win rate, drawdown, and profit factor.
- Modern tools like TradingView or MetaTrader simplify this process.
- However, beware of overfitting — designing strategies that work only on past data.
Trade Execution and Psychology
- Even with a robust strategy, emotional control matters.
- Fear, greed, and FOMO (Fear of Missing Out) cause irrational decisions.
- Maintaining a trading journal to track performance improves consistency.
Limitations and Common Mistakes
- Lagging Indicators: Most signals confirm trends after they begin, not before.
- Over-Optimization: Too many parameters reduce real-world reliability.
- Ignoring Fundamentals: Technicals alone can’t predict corporate earnings or macro shocks.
- Overtrading: Frequent trades increase costs and emotional fatigue.
- Bias Confirmation: Traders see what they want to see — a classic cognitive trap.
Despite limitations, when combined with risk management and fundamentals, technical analysis remains one of the most powerful frameworks for decision-making.
Real-World Examples of Technical Analysis for Stocks
Example 1: Apple (AAPL) Trend Confirmation
- In early 2023, AAPL’s 50-day SMA crossed above its 200-day SMA — a golden cross.
- Volume confirmed the move, and RSI stayed between 55–70, indicating healthy momentum.
- Investors who entered near $145 could capture a 25% gain over the next quarter.
Example 2: Tesla (TSLA) Volatility Analysis
- Tesla’s price often exhibits high ATR values, showing large intraday ranges.
- Traders use Bollinger Bands and MACD crossovers to time short-term entries while managing risk with wide stop-loss levels.
Example 3: Sector Rotation Using RRG
- Using Relative Rotation Graphs, traders can visualize sector strength relative to the S&P 500. In 2024, technology rotated from “Leading” to “Weakening,” while utilities moved into “Improving” — signaling defensive positioning opportunities.
Conclusion
Technical analysis for stocks is a powerful method used to evaluate and predict stock price movements based on historical data and chart patterns. It helps traders identify trends, momentum, and potential reversal points by analyzing price action and trading volume. By relying on technical indicators and charts, investors can make more informed decisions, manage risks better, and improve their chances of profitability. Ultimately, technical analysis serves as an essential tool that complements other forms of market research, enabling traders to navigate the complexities of the stock market with greater confidence and precision.
>>See more:

